SonicWall Analyzer End of Life and SonicWall Analytics Review
by

Scott Glew
It has not been widely publicised, but SonicWall's legacy reporting application, SonicWall Analyzer, is end of life (EOL) status. It is no longer being sold, and has been under 'limited support' since April 24th 2019. Limited support means no new code fixes will be released except under extreme circumstances, and 'best efforts' will be made to provide known workarounds. Support for SonicWall Analyzer will be discontinued entirely in April 2020.
SonicWall's upgrade path for Analyzer is SonicWall Analytics. Information on the product page is a little limited, as least at the time of writing this (September 2019). It lists some high-level features and the "more information" link takes you to a corporate video featuring people walking through data centres looking at tablets, with a few screenshots of the product towards the end.
SonicWall Analytics Review
The best way to get a feel for what SonicWall Analytics offers is by heading to the demo section on SonicWall's website and trying the online demo of SonicWall Analytics.
I gave the live demo a spin, so here's my short review of SonicWall Analytics and some initial thoughts.
GlobalView
One of the features of SonicWall Analytics is the aggregation of data across your SonicWall deployment. Unfortunately, in the online demo, the reports and dashboards under GlobalView were not working. This may be a limitation of the online demo, as they're obviously there for a reason. But this is the message you get in the online demo:
Viewing Individual SonicWall Devices
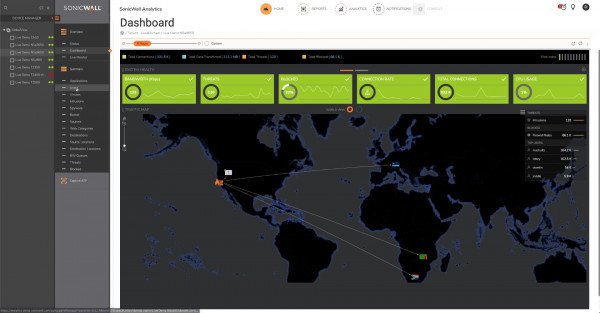
Not to worry. Clicking on the individual SonicWall devices on the left, shows some useful information, starting with this Dashboard:
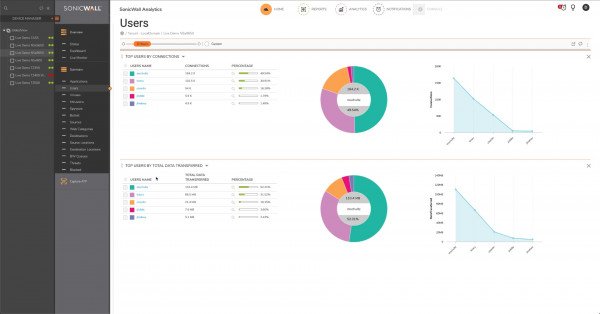
There are a range of options under 'Summary' such as this Users summary:
Clicking the magnifying glass icon in each row 'should' let you drilldown into any of the views under the Analytics section filtered by the user (more on the Analytics section later), however this option is disabled, or not working in the online demo. It was working for other views such as Web Categories.
Reports View
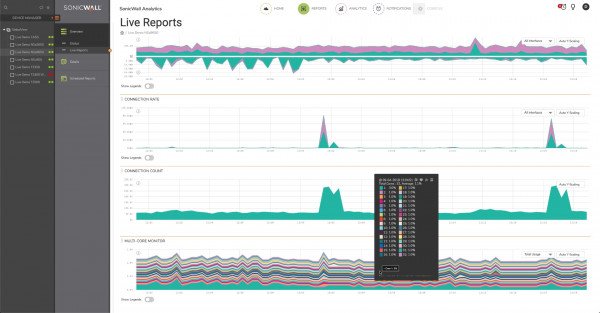
Clicking the Reports section at the top of the interface provides a Live Reports section showing the traffic coming in and out of your SonicWall.
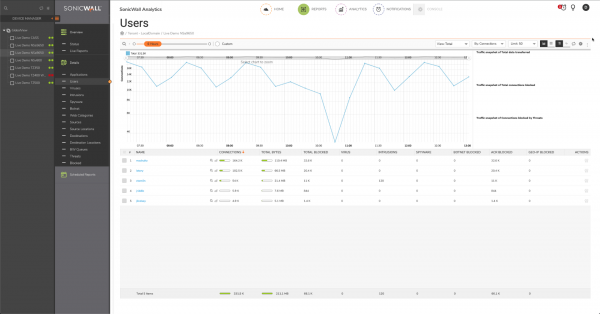
The Users report contains Line chart showing the Number of Connections over Time, and a table with a list of authenticated usernames. You can search the table for specific users using the Search option, and again, clicking the magnifying glass icon in each row provides the option to 'drilldown'.
Analytics View
Clicking the Analytics section at the top of the interface provides sections for Overview, Web Activities, Blocked and Threats. Each section has three sub-sections: Groups, Graphs, and Session Logs. The Groups sections contain a range of Tabs such as Applications, Web Activities, Sources, Destinations, Threats, Devices, BWM and Blocked.
Analytics - Groups View (Web Activities)
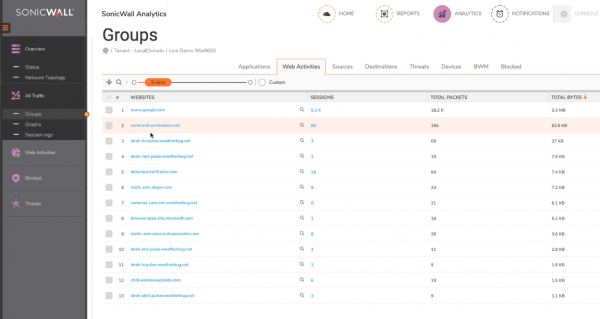
The Web Activities group displays a list of websites accessed, including the sub-domain of each site. This results in a fairly cluttered view. As you can see in the screenshot above weatherbug.net appears six times in the top 13 sites due to all the different sub-domains used by the service:
- desk-for-pulse.weatherbug.net
- desk-cam.weatherbug.net
- cameras-cam.cdn.weatherbug.net
- desk-obs.pulse.weatherbug.net
- desk-lx.pulse.weatherbug.net
- desk-alert.pulse.weatherbug.net
In Groups view, you can slide the orange time selector at the top to report across more days, such as the past 5 minutes, 24 hours or 3 days.
Increasing the time range increases the time for the full data set to be returned, with the percentage complete shown at the bottom of the table.
Filter Limitations
The table can be filtered by most log SonicWall log fields, so you can filter the list of sites by a particular user for example.
You can filter by multiple fields, such as User: scott and Websites: www.fastvue.co, but you cannot enter multiple values such as Websites: www.fastvue.co, www.sonicwall.com.
The value you enter must also be an exact match. So, Websites: fastvue.co will not match. You must enter Websites: www.fastvue.co (include the www). There are no options for 'Contains' or 'Ends With'.
This means you cannot create a filter that shows all the weatherbug.net sites in the screenshot above, as you can only enter one. This severely limits the ability to conduct specific investigations, such as finding all the Source IPs that accessed 'weatherbug.net', or all the sites that fall into the 'Adult' or 'Gambling' categories.
Analytics - Graphs View
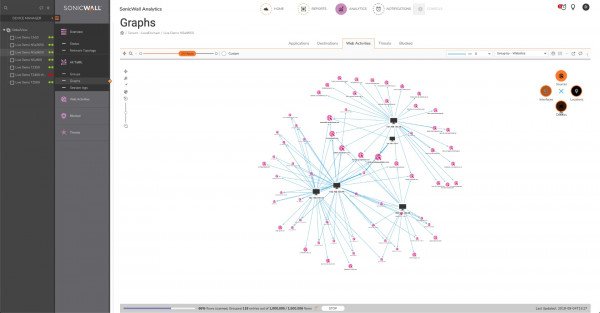
The Graphs section displays a Network Graph with the relationships between Sources, Interfaces, Locations or Devices, and Websites, Applications, Categories and URLs. These options change depending on the tab you're on.
This example shows the relationships between Source IPs and Websites.
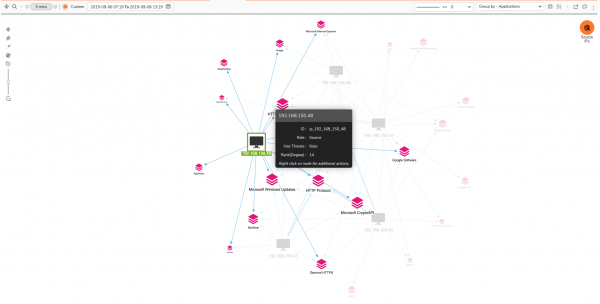
You can zoom in and out of the chart, and select nodes to highlight the connected relationships. Here's a slightly zoomed in version with a Source IP selected, showing the relationships with its applications:
Personally, I'm not a huge fan of these types of views for investigating information. There's a lot of zooming, navigating and selecting required just to show the list of Applications or Websites accessed by an IP, and it's difficult to find the applications or sites you need to be concerned about. But they look interesting in product datasheets! :)
Analytics - Session Logs
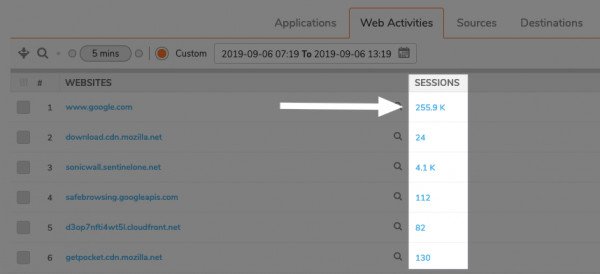
Each 'Group' view includes a Sessions column and clicking on the value takes you to the Session Log filtered by that item.
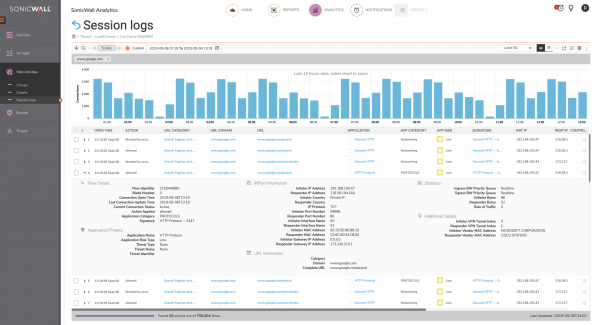
The Session Log views provide all logged information relating to your filter.
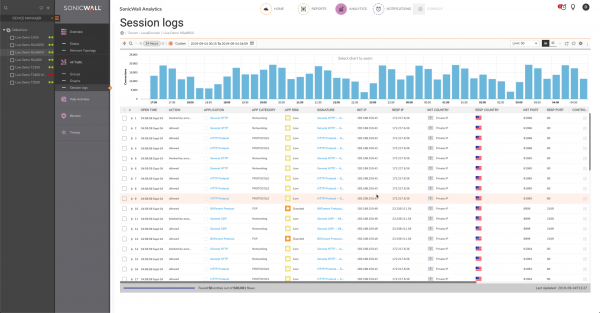
You can also expand each row in the session log to view information that is not necessarily included in the list of columns. Here I've clicked the Sessions related to www.google.com and expanded a result for www.google.com/search.
Unfortunately, the rest of the URL (including the search term) is not displayed in the full details.
Summary
While exploring the interface, I was trying to see how easily I could find the websites accessed by a particular user, and the users that accessed a particular website.
Most reports and tables include a 'magnifying glass' icon that gives you a nice way to drill down into one of the other Groups, Charts or Session Logs in the Analytics view.
Unfortunately, Users is not an option when drilling down so you cannot select a website or web category and jump to the users that accessed it. These are the options when drilling down into www.google.com:
In case you're wondering, the Sources option shows Source IPs, not Users.
You can, however, start in Reports | Details | Users and click the magnifying glass next to a user and select the Web Activities section under Groups to view the websites that the user accessed. But again, this shows a cluttered list of websites due to the inclusion of sub-domains. Even if sub-domains were excluded, advertising, cdns and visitor tracking widgets would make it very difficult to get an idea of what the user was browsing online (this is the problem that Fastvue Site Clean solves).
Another Option for SonicWall Internet Usage Reports
If you need to send Internet usage reports to HR, department managers, School principals etc, then SonicWall Analytics is not going to provide them with the information they need.
Fortunately, Fastvue Reporter for SonicWall has been designed from the ground up with this use case in mind.
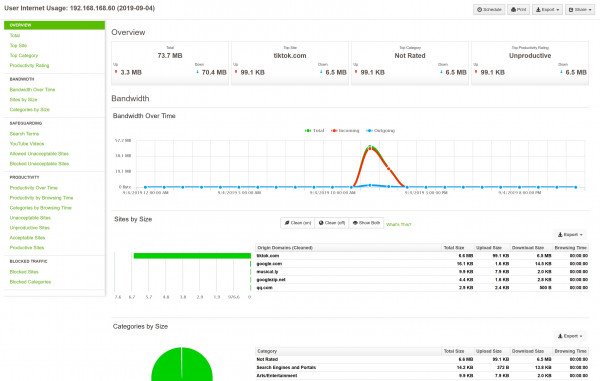
Investigating a User's online activity is easy with User Overview Reports.
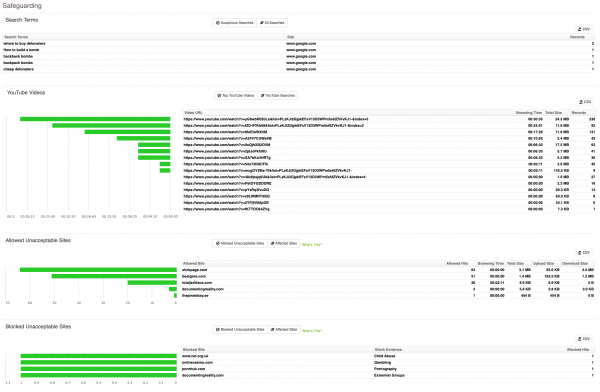
We also include a Safeguarding section, making it easy to view search terms you should be concerned about, YouTube videos accessed, and blocked and allowed unacceptable websites.
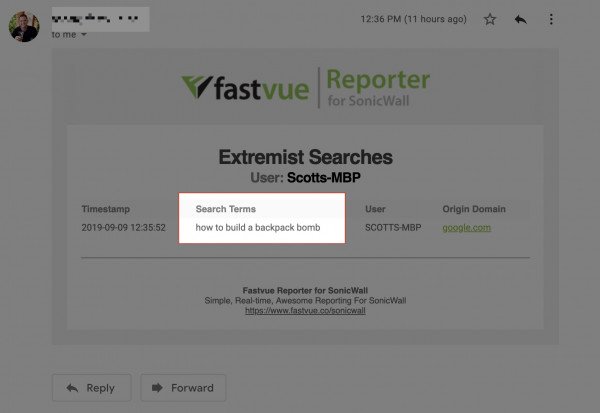
You don't even need to run reports with the real-time alerting feature. The right people can receive timely information in their inbox as soon as it happens.
If you're interested in taking it for a spin, go ahead and download our free 30-day trial!
Did I miss something in my review of SonicWall Analytics above? What are your thoughts? Let us know in the comments!
Take Fastvue Reporter for a test drive
Download our FREE 30-day trial, or schedule a demo and we'll show you how it works.
- Share this storyfacebooktwitterlinkedIn
SonicOS 6.2.6.0-20n New CFS and New Logging Bugs
Introducing Fastvue Reporter for SonicWALL. SonicWALL Reporting Made Awesome!

